Monday, April 30, 2012

What Made Me Trade This System?

After 4 months, my contest account is doing fairly well, around +42% or so for the year.  I had predicted around 150% per year, so at this point I'm a little behind the 50% return I had hoped for.  But, I'm sure the 8% difference is within the error bounds of my calculations... : )

You might wonder why I decided to trade this particular system.  What research did I do to show it would be good?

Basically, I came up with an idea, and just ran it through the data.  No optimization (although I did look at some different stop levels and profit targets, my initial "hunch" for values were near optimum, so I changed nothing).

This wasn't your typical run of the mill Tradestation optimization.  It took me a solid 2 weeks of testing, both in Tradestation and in Excel.

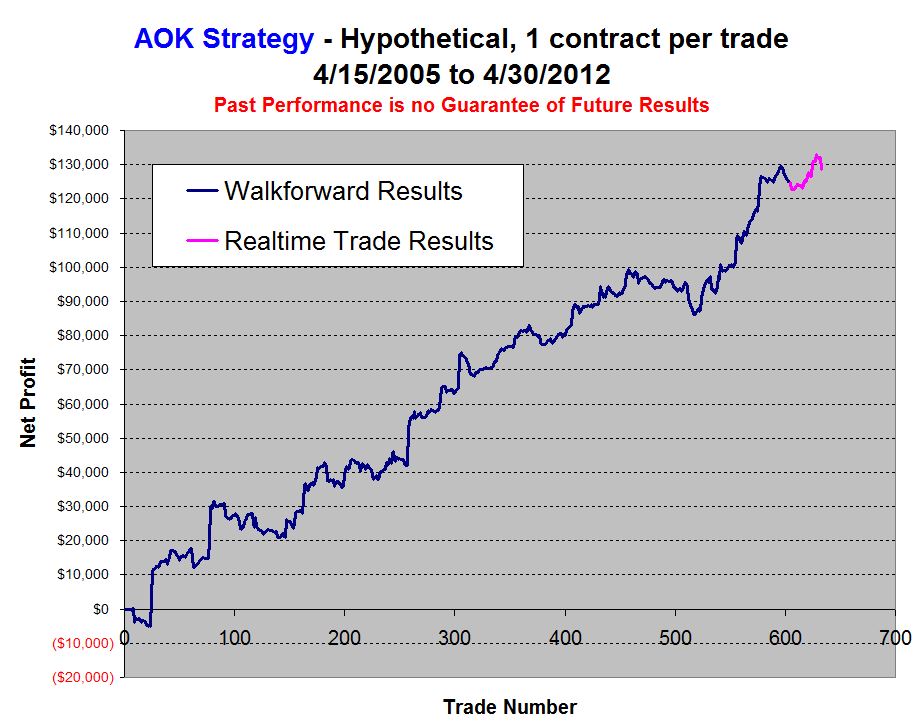
The graph below says it all.  It shows the walkforward and real time (both hypothetical) results for this system, assuming 1 contract per trade.

What I like about this system/ why I decided to trade it:

1)  Nearly 7 years of historical trade results, all walkforward tested (not your traditional backtest).  If you don;t know why I like walkforward testing about 1,000 times as much as backtesting, just go to my website and look at my articles.

2)  Approximately $200 average profit per trade, even after commissions and slippage (Side Note: I assume $50 round trip commissions and slippage.  In reality thru April, it is more like $29.  So, that "juices" performance by 10% or so.  I get this through working and timing the orders a bit).

3)  Steadily increasing equity curve.  It looks good, but is not without its faults.  It looks "real" to me, which is what I look for.


I'm curious what others think out there.  If these were your research results, would you trade this system?


Friday, April 27, 2012

Holding Steady, Continued

Contest

Wow.  Not much change since Monday.  Kind of nice.  I'm still hovering around 48%.  Only 4 positions open, although 2 are highly correlated, and another is a double position.

As promised, here is another installment in "The Trading Process"

****************************************************************

The Trading Process - Rate of Return

As part of your Trading Plan, you really need to know where you want to go.  By this I mean "what rate of return on your trading capital do you want?"

It is not enough to say "I want to get rich trading."  You really have to quantify it, for 2 good reasons.

First, you want to make it real.  In goal setting, a statement like "I want to earn 50% per year" is much better than "I wanna be rich."

Second, with a written number, you'll have a target to measure your strategies against.  Do the strategies meet your goals, or not?

So, Step 2 is "Determine Your Desired Rate of Return."

EXAMPLE: I did exactly this as part of developing a system for this trading contest.  In my case, I wanted a rate of return that could win the contest.

So, first I went back and looked at previous winners (http://www.worldcupadvisor.com/worldcupchampionships/default_nwcc2.aspx, click on "See Full List" under Previous Winners section).  Based on previous winners, I estimated that 100-150% annual return would probably put me in the top 3, and possibly in the top spot overall.  That became my goal.

Consequently, for this contest, I decided to build a trading strategy that had a reasonably good chance of returning 100-150% in a year's time.  If I found a strategy that returned 50%, I set it aside, since it did not meet my goal.

Of course, the flipside to the rate of return is also important.  I'll talk about that next time.


Wednesday, April 25, 2012

Tuesday, April 24, 2012

The Trading Process

Contest Update:

I am up around 48% for the year (equity graph at the very bottom).  That should put me back into the standings.  If so, maybe I can actually stay there a while!  My contest account has not been very consistent, to say the least!
http://www.worldcupadvisor.com/worldcupchampionships/default_nwcc2.aspx

*************************************************************

Since I don't show charts of my entries (because as I mentioned earlier, I don't use charts to make my trading decisions), I thought it might be useful for my esteemed readers to at least understand the process I used to create this contest trading strategy.

So, starting today, and maybe once or twice a week (hint: the more feedback I get on this, the more encouraged I will be to add more posts!), I'll walk you through the steps I used to develop this system.  There are some things I did specifically because this was a contest system, so keep that in mind when you develop your own strategy.  Hopefully you'll find value in this series of posts.


DEVELOPING A TRADING SYSTEM 

Today we will start at the beginning.  To succeed in any trading activity, you must HAVE A PLAN.

Sounds simple, right?  You'd be amazed, though, at how many people don't have a plan for trading.  Instead, they have some vague ideas of buying and selling something, and very specific ideas about how much money they'll make doing it.  That "shoot form the hip" mentality almost never works.

So, step 1 is to HAVE A TRADING PLAN.  

Some people will tell you that you need a 200 page, written plan.  One that you refer to and consult with everyday.  Well, that might work for some people, but not for me!

I keep things as simple as possible.  Occam's Razor is a concept I always keep in mind.
(As an aside, you can read about my trading philosophy in a section I wrote for Brent Penfold's book "The Universal Principles of Successful Trading: Essential Knowledge for All Traders in All Markets (Wiley Trading)"    http://www.amazon.com/The-Universal-Principles-Successful-Trading )

A Trading Plan should have everything you think you need, and nothing more.  Of course, too little detail is not good, so there are some things that should be in your plan, at a minimum.


In the next installment, I'll list some of the important things a Trading Plan should have.

Comments and questions are encouraged!


Saturday, April 21, 2012

Where's The Stop, Dude?

Contest:

I am back up to +30% for the contest.

My friend Kurt is in 1st Place now.  He is a great and CALM trader.  Everyone better watch out!
http://www.worldcupadvisor.com/worldcupchampionships/default_nwcc2.aspx

******************************************


One positive trading day all week. Four losing days.  Yuck.  But there is always next week...


You still might be puzzled by the large loss I had earlier this week from a 1 lot. Over $3,000.

You might be wondering "Hey dumba**, why didn't you have a stop?"

Good question!


Here is an answer:

It is always good to have a stop loss point.  For most people, having a firm stop loss order in the market is the only way to go.  "Mental" stops - the ones where you tell yourself you'll get out when price hits the stop point - work only for very disciplined traders.

I use hard stop losses quite a bit.  Here is a screenshot of some of the ones I have going right now (these are not in the contest acct).


So, that is Option A:  Have a firm stop loss order entered at all times. (most people should stick to this)

I also use some other types of stops:

Option B:  Exit next bar next bar Open if loss at close exceeds stop level (mental stop)
Option C:  Exit next bar next bar Close if loss at current bar close exceeds stop level (mental stop)
Option D:  No stop

For the contest, I am using Option C.  With the particular way I am trading, I found that waiting a while (until the next close) after my stop was "hit" on average made the loss smaller.


So, I do have a "stop loss" point, but it is not typical.  It leaves me exposed to market action like I had this week.

C'est la vie.


Wednesday, April 18, 2012

Exited the Big Loser

Down a little bit today...

You might wonder "what in the world happened?" since my equity high of last Friday, and the big celebration I had over the weekend for entering the Top 5 in the contest standings.

Well, 80% of the loss these past 3 days was one position of 1 contract.  See the chart below.

Obviously, the risk incurred was way out of line for the account size.  But, that is almost always the case for small accounts - the risk for even a 1 lot futures contract may be too much for most accounts.

The bright side of all this is that I followed the plan, and the system.

Acknowledge, and move on.

(By the way, there was no celebration over the weekend.  The only day I would celebrate is on December 31st, after contest results were in, and after I made Pigs in a Blanket for about 30 people to eat on New Year's Day!)


Uncertainty


One really tough part about being a trader is dealing with the uncertainty. What will happen tomorrow?  More of the same, or a turnaround? My current performance is a good example...

Two trading days ago, I was at a new equity high.  Over 60% return for the year.  Pretty good.

Now, I am looking at a 2 day drawdown of around 25%. Not so good.

If I knew tomorrow would bring a recovery, I'd probably not give it a second thought.

But, what if tomorrow is bad, just like the last 2 days?  The thought of it is unsettling, to say the least.  Watching profits vaporize is painful.  Crowing about entering the top 5, and then falling out 2 days later, is downright embarassing, too!

At the end of the year, I won't even remember this particular day (except for the blog post).  But right now, it is easy for this to be my focus.

Will I, and when will I, recover to a new equity high?  The uncertainty of it all can be a killer.

Trading is emotionally gut wrenching.  Don't let anyone tell you otherwise.  It does get easier over time (10 years ago a 2 day, 25% drawdown would probably have me puking until I was doing dry heaves!), but the pain of losing (and joy of winning) is always there to some extent.


Tuesday, April 17, 2012

Why No Charts of Trades?


Based on a comment I made in a previous thread about other blogs, and showing trading charts, I thought I'd clarify something.

For this contest system, I do NOT look at current charts at all.

It doesn't matter to me if the current 1 minute/5 minute/60 minute/daily/weekly/monthly chart is an uptrend, downtrend or sideways trend.
It doesn't matter to me if the price is above/below moving average/MACD/trendlines.
It doesn't matter to me if support and resistance lines exist, and it doesn't matter where they are.
It doesn't matter to me if the market is overbought/oversold (whatever those terms really mean - most people don't know, except in retrospect).

I use those sorts of things on other systems I trade, but not for this system.

That is why you won't see any trading charts to explain my entries.  I may show some charts now and then, to explain other aspects of my strategy.


Saturday, April 14, 2012

New Equity High


Hello Kevin Davey -

Welcome back to the Top 5 Standings.  Feel free to stay a little longer this time!

Sincerely -


World Cup Futures Trading Contest
http://www.worldcupadvisor.com/worldcupchampionships/default_nwcc2.aspx


P.S.  Remember, you are only #4.  Barely.  Hanging onto it by a thread.  And it is a long contest.


Tuesday, April 10, 2012

Almost a New High


OK!  Kind of ironic that on the same day I make a blog post titled "Boy am I an Awful Trader" I get very close to hitting a new equity high...long overdue, I might add...

Let's hope this trend continues!


Just to summarize my current situation.  I am in 6 positions right now:

1 Big Loser
1 Little Loser
2 Little Winners
2 Big Winners (where I've doubled my position)

I see some potential new trades later in the week, but for now I'll just hopefully keep riding the winners.


Boy Am I An Awful Trader!

Every once in a while, when things are going good, I think that I am a pretty good trader.  Usually, a couple days pass and I realize I was totally mistaken!

So, to keep my ego in line, and to continuously remind myself that I must improve, I like to look at some of my bad trades.

Here is a good one that I took in this contest account.  I added to a profitable short near the low, then EXITED WITH A BIG LOSS AT THE EXACT HIGH!  A nice fat, juicy loss, I might add.

To add insult to injury, the market abruptly turned once it flushed me out!  Had my stop loss not been hit, I'd be up $1,700 more in the contest account.  17% additional.

Oh well.

The good news (for me) is that I followed my rules precisely.  In this case, though, the rules did not work out so well.


Maybe this approach will help you - when your ego thinks you are great, give it a reminder or two that you are not!


Monday, April 9, 2012

Can You Make Money Everyday?


This was a comment from an earlier post.  It is such a good question, I thought it best to answer as a blog post...

"Good stuff Kevin. I tire hearing of the "make a little each and every day" mentality. Maybe it can be done, but I've yet to see any documented equity curves of anybody doing it. Lord knows I've tried...Funny thing is, seems the less you worry about chasing the ideal of "steady income" the easier it is to be profitable at the end of the year. 


In my experience, most if not all of the year's profits come in less than 6 months and sometimes from even just a few great months. 


I've questioned a few popular authors/educators on this, but all they ever give is the impression that they or an unnamed "friend" are profitable nearly every day. Of course, there is always some excuse why they cannot provide any kind of documentation of this. 


In your opinion, are they selling a pipe dream or do you personally know of anyone profitable on a nearly daily basis over a period of years? And I don't mean the kind of trader that makes a little every day then loses a year's worth of work in a day or two.


Sorry for the long, rambling post but I wanted to year your thoughts as you are one of the few that speak the truth."


Thanks!

In regards to being consistently profitable, I posted almost the same question recently in the Tradestation user forums.  I was interested in finding out 1) if anyone truly was consistently profitable and 2) how they did it.

No one stepped forward, although one person was a "make money every day until I blow up" type.  He was selling options.  He did eventually blow up.

I, too, see lots of people claiming to make money every day trading.  Maybe they are, and I'm doing everything wrong in making money only about 50-60% of days.  BUT, I've never seen actual proof of these "money machines."

It is kind of like Big Foot or the Loch Ness Monster - lots of people claim to have seen it, or know a friend who has seen it, but until you personally see and touch it, you have to wonder if it even exists.

My guess is that 99% of people selling a method that they claim can make money everyday are lying.

Old floor traders would make money nearly every day, and scalpers and high frequency traders might too.  Note, though that both of these groups have a distinct advantage (location, technology, resources) that the rest of us do not have.  But, it seems to be pretty hard to do for the average retail trader.

So, my opinion is that it (making money almost every day, year after year) theoretically can be done, but for 99% of us out there, it can't be done.  And we should not even try!  Instead, go with methods that make money long term, but not necessarily each and every day.

Note: I am totally open to being proven wrong on this.  Just e-mail me if you are a consistent daily money maker, and we can talk.


By the way, I was able to dig up my 2005 monthly equity curve in the contest.  As you can see, I had a 30% drawdown on a monthly basis, so I'm sure on a daily basis it was even greater than that.


Friday, April 6, 2012

Are Drawdowns Normal?

For those of you who haven't traded futures, you might be wondering if the large drawdowns my contest account has had are "normal."

First, just so everyone is on the same page, a drawdown is a drop in equity, measured from the peak to the trough.

Here is my equity curve for the contest, with the 4 largest drawdowns identified:


4 BIG drawdowns, in just the first 3 months!  Most people would not be to handle these, especially the 49% drawdown.  Who can handle losing half of their account?

Keep in mind that these drawdowns are for a contest account - my personal accounts have smaller drawdowns.  Although, I have experienced a 50% drawdown before in my less leveraged accounts, back in 2010.

Drawdowns are simply part of the trading game.  People that tell you trading drawdown free trading is possible are not being truthful, in my opinion.


So, how do these drawdowns compare to other contest participants?  My friend Andrea Unger, one of the best traders I know, and a three time winner of this trading contest, shared the following equity curves with me.


What is fascinating is that in each of those years he had at least one drawdown approaching 50% (in his best year of 2008, it looks like he had a 75% drawdown).   But, he ended each year with over 100% return (115%, 240%, 672%).

 PERFORMANCE LIKE THIS MAKES ANDREA ONE OF THE BEST TRADERS I KNOW - BECAUSE OF HIS ABILITY TO WITHSTAND DRAWDOWNS.

Most people would have given up during one of the drawdowns.  But, not Andrea.  He had a solid trading method, and he knew that he would recover from those drawdowns.  And, each of those years, he won the contest!


So, what are the lessons here:

1.  Drawdowns are normal for trading futures, and drawdowns can be extreme.


2.  Drawdowns occur even with solid trading methods.  The key is to realize that you can't quit because of a drawdown (unless, of course, it is far beyond your expectations - signifying a broken system).


3.  Successful traders do not fall victim to drawdowns - they endure them.


4.  IF YOU CAN'T HANDLE DRAWDOWNS, DON'T TRADE.


A big "thanks" to Andrea for sharing his equity curves.  Please visit Andrea's website: http:///www.oneyeartarget.com  to learn more about Andrea and his trading.


Thursday, April 5, 2012

Chart Formations?

Is there any predictive value in seeing patterns in my equity curve?  My friend Andrew sees a double top, which may mean a down leg in equity is near.

Ignoring the initial up leg, I see recent higher highs and lower lows, which might mean the trend is up.

Then again, patterns might have no relevance at all to future performance!

Maybe the same could be said about chart formations on price charts...

Up 22.2% for the year.


Van Tharp Article

In case you missed it, here is a link to an article I wrote for Dr. Van Tharp.

Let me know if you find it interesting!


Monday, April 2, 2012

Some First Quarter Statistics

Here are some statistics for the first quarter.

First, there are 3 "strategies" I am evaluating:

A.  Baseline Strategy, always trades 1 contract [hypothetical]
B.  Add-On Strategy, adds to winning trades at a specific point [hypothetical]
C. Add-On Strategy Hybrid, how I actually added on to winning trades (I changed the approach in Feb/Mar timeframe to eliminate discretion of the 2nd entry) [this method is what is actually being traded]


So, including open trades, here are the Net Profits:


For at least the first 3 months, then, it would have been better to just trade 1 contract, rather than add on to winners.


Here are some other statistics for the Baseline and Add-On strategies.  These include open trades